Lecture 7: Classification II: Evaluation and Tuning
DSCI 100
Housekeeping
- Your midterm is THIS WEEK!
- Closed-book Canvas quiz
- Requires Lock Down Browser (LDB). Ensure this is installed prior to your midterm and test it out using the practice quiz.
Confusion matrix
Here is an example of confusion matrix with cancer diagnosis data we’ve seen before.
| Predicted Malignant |
1 |
4 |
| Predicted Benign |
3 |
57 |
Confusion matrix
Typically we consider one of the class labels as “positive” - in this case the “Malignant” status is more interesting to researchers, hence we consider that label as “positive”.
Relabeling the above confusion matrix:
| Predicted Positive |
1 |
4 |
| Predicted Negative |
3 |
57 |
Note that:
Top left cell = # correct positive predictions.
Top row = # total positive predictions.
Left column = # truly positive observations.
Precision and Recall
\[
{Precision} = \dfrac{{\#\; correct\; positive\; predictions}}{{\#\; total\; positive\; predictions}}
\]
\[
{Recall} = \dfrac{{\#\; correct\; positive\; predictions}}{{\#\; total\; truly\; positive\; observations}}
\]
Recall:
| Predicted Positive |
1 |
4 |
| Predicted Negative |
3 |
57 |
Here, precision = 1/(1+4) and recall = 1/(1+3).
Which Metric is More Important?
It is application/context dependent. Use your judgement/logical reasoning.
For example:
a 99% accuracy on cancer prediction may not be very useful. Why?
If we need patients with truly malignant cancer to be diagnosed correctly, what metric should we prioritize?
What if a classifier never guess positive except for the very few observations it is super confident in? What metric is affected?
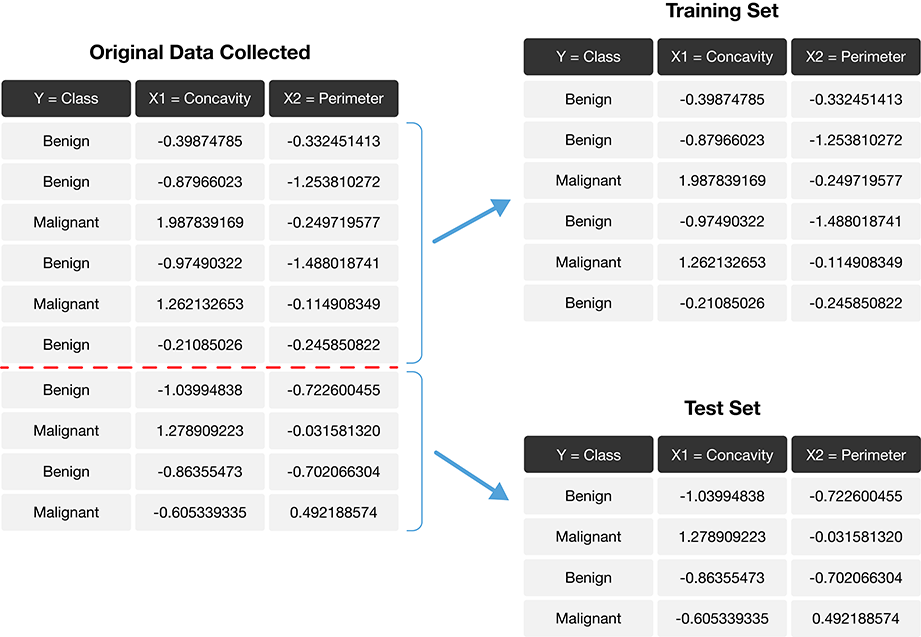
Step 1. Split our data into two subsets
![]()
Step 1. Split our data into two subsets
The role of the training and test sets
![]()
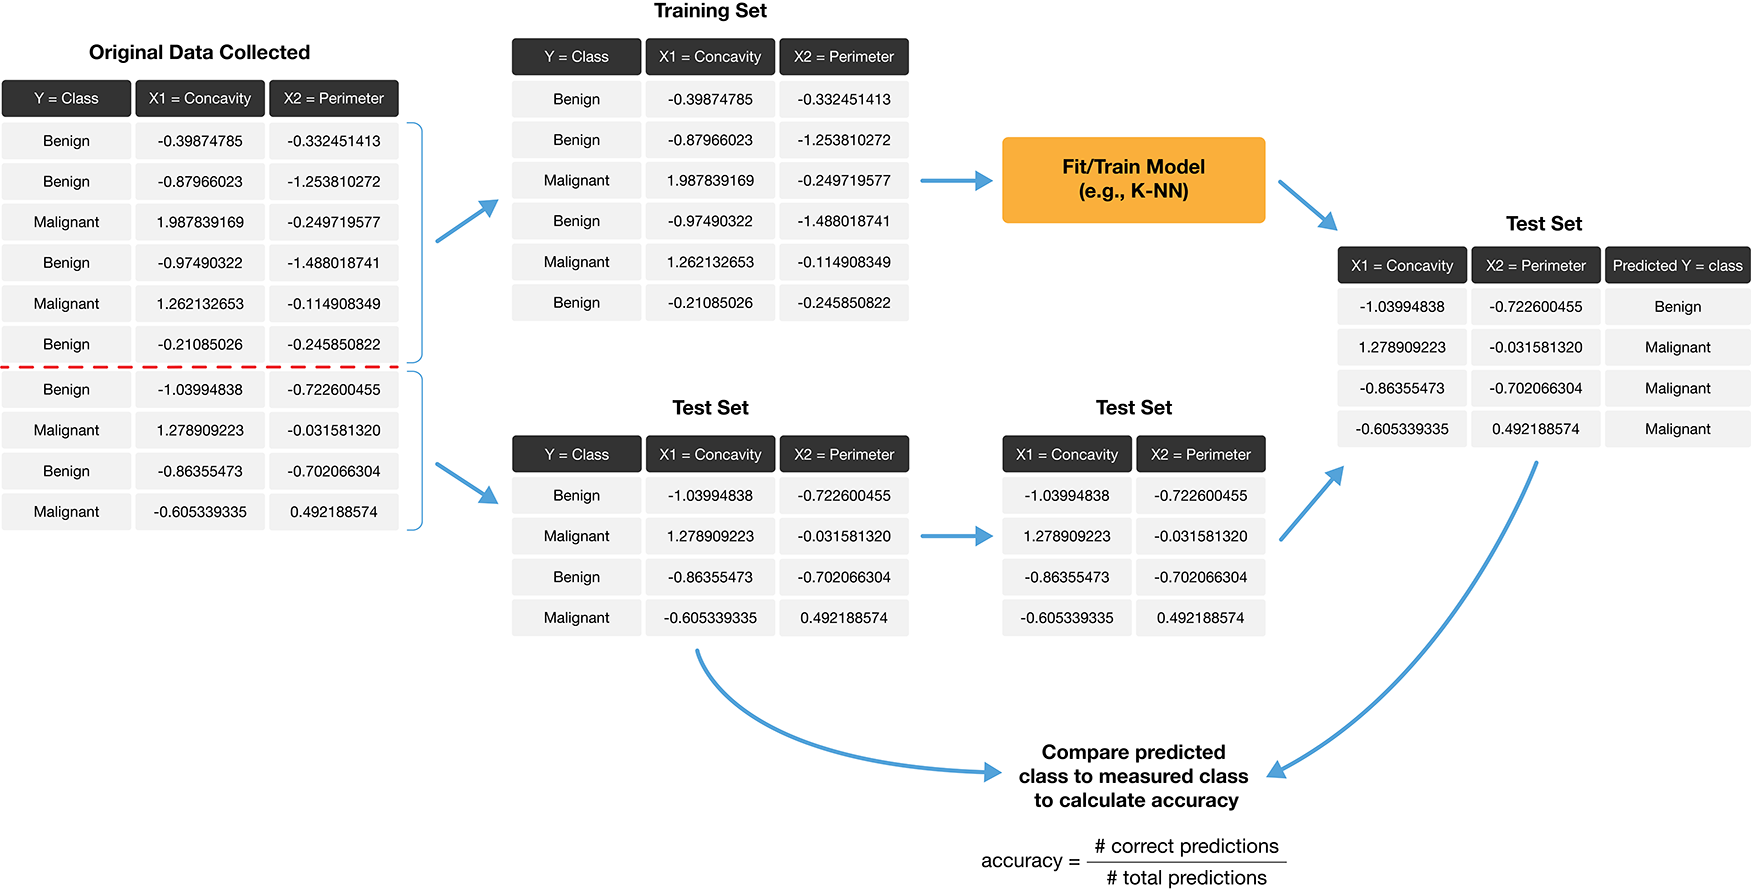
Golden Rule of Machine Learning / Data Science
Don’t use your testing data to train your model!
Why?
Showing your classifier the labels of evaluation data is like cheating on a test; it’ll look more accurate than it really is
- “training your model” includes choosing K, choosing predictors, choosing the model, scaling/centering variables, etc!
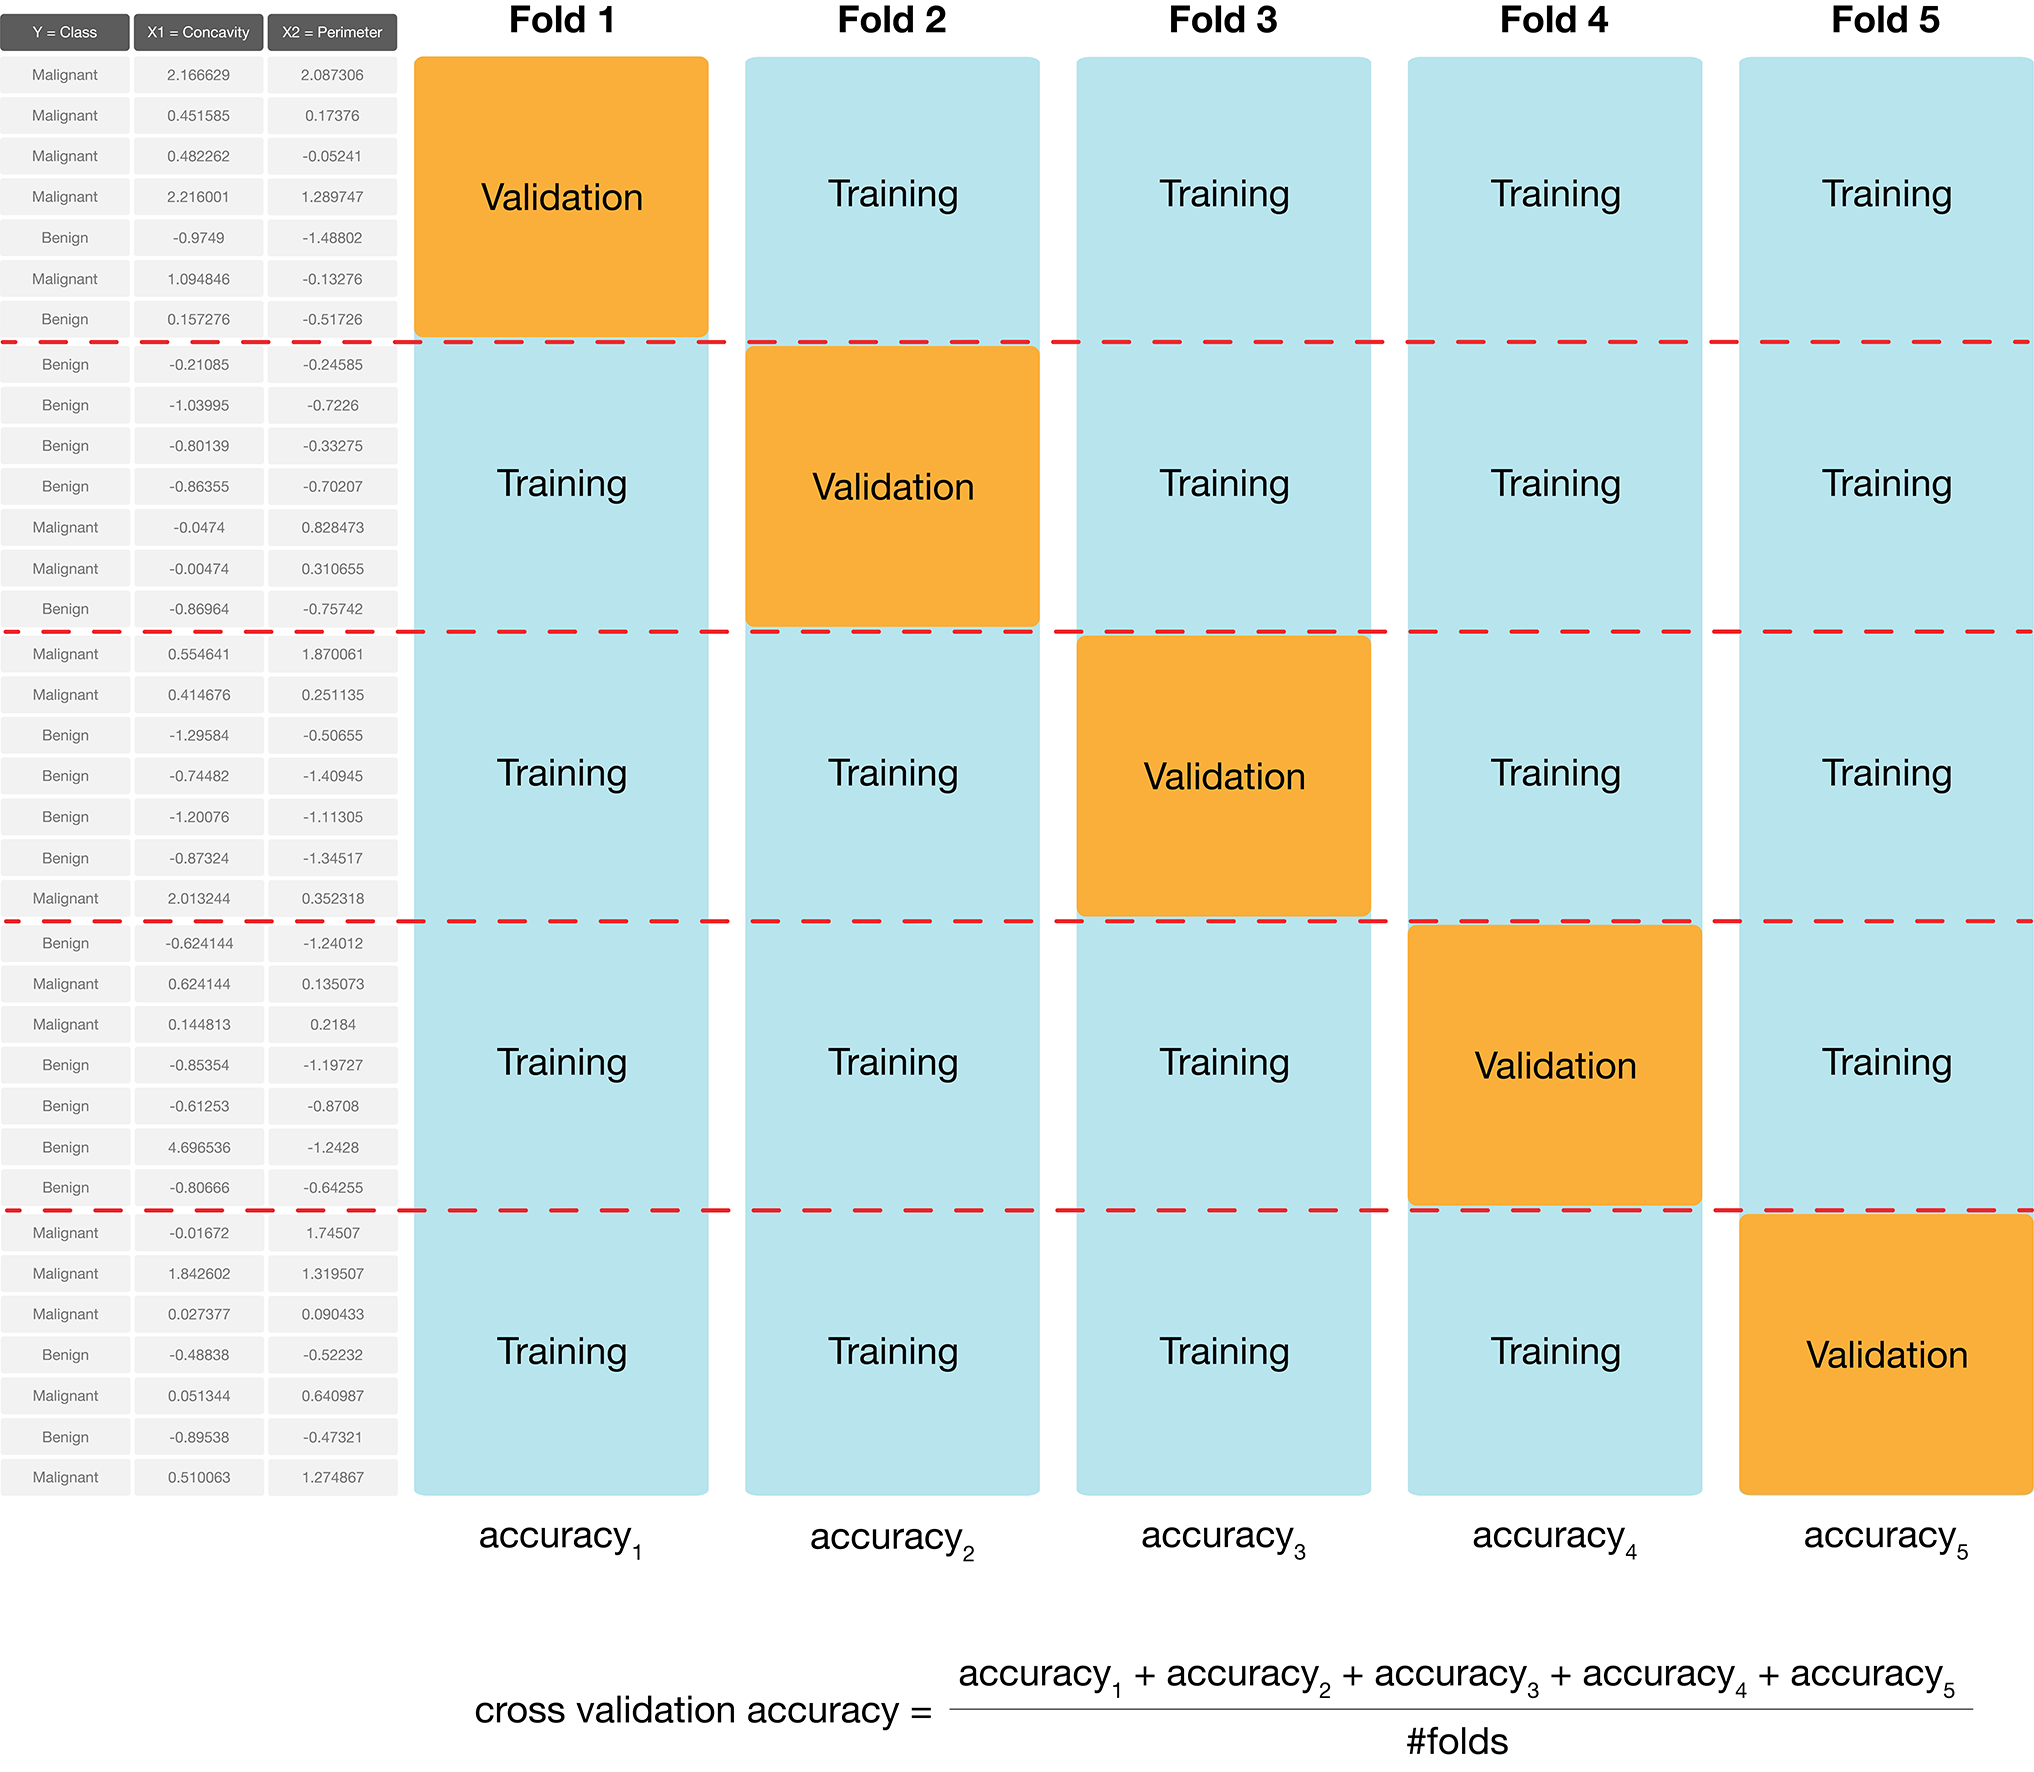
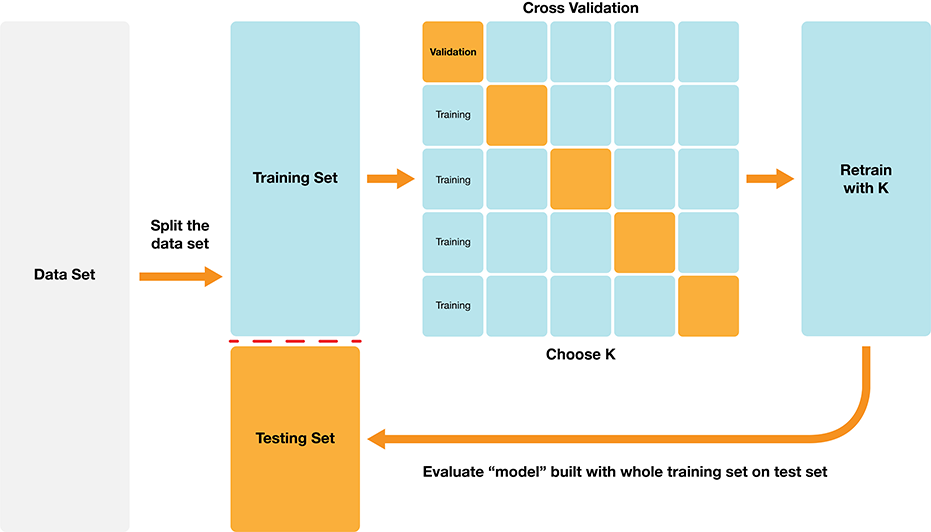
Step 2: Choosing K (or, “tuning’’ the model)
Choosing K is part of training. We want to choose K to maximize performance, but: - we can’t use test data to evaluate performance (cheating!) - we can’t use training data to evaluate performance (that’s what we trained with, so poor evaluation of true performance)
Solution: Split the training data further into training data and validation data sets
2a. Choose some candidate values of K
2b. Split the training data into two sets - one called the training set, another called the validation set
2c. For each K, train the model using training set only
2d. Evaluate accuracy (and/or other metrics of performance) for each using validation set only
2e. Pick the K that maximizes validation performance
But what if we get a bad training set? Just by chance?
Underfitting & Overfitting
Overfitting: when your model is too sensitive to your training data; noise can influence predictions!
Underfitting: when your model isn’t sensitive enough to training data; useful information is ignored!
Source: http://kerckhoffs.schaathun.net/FPIA/Slides/09OF.pdf
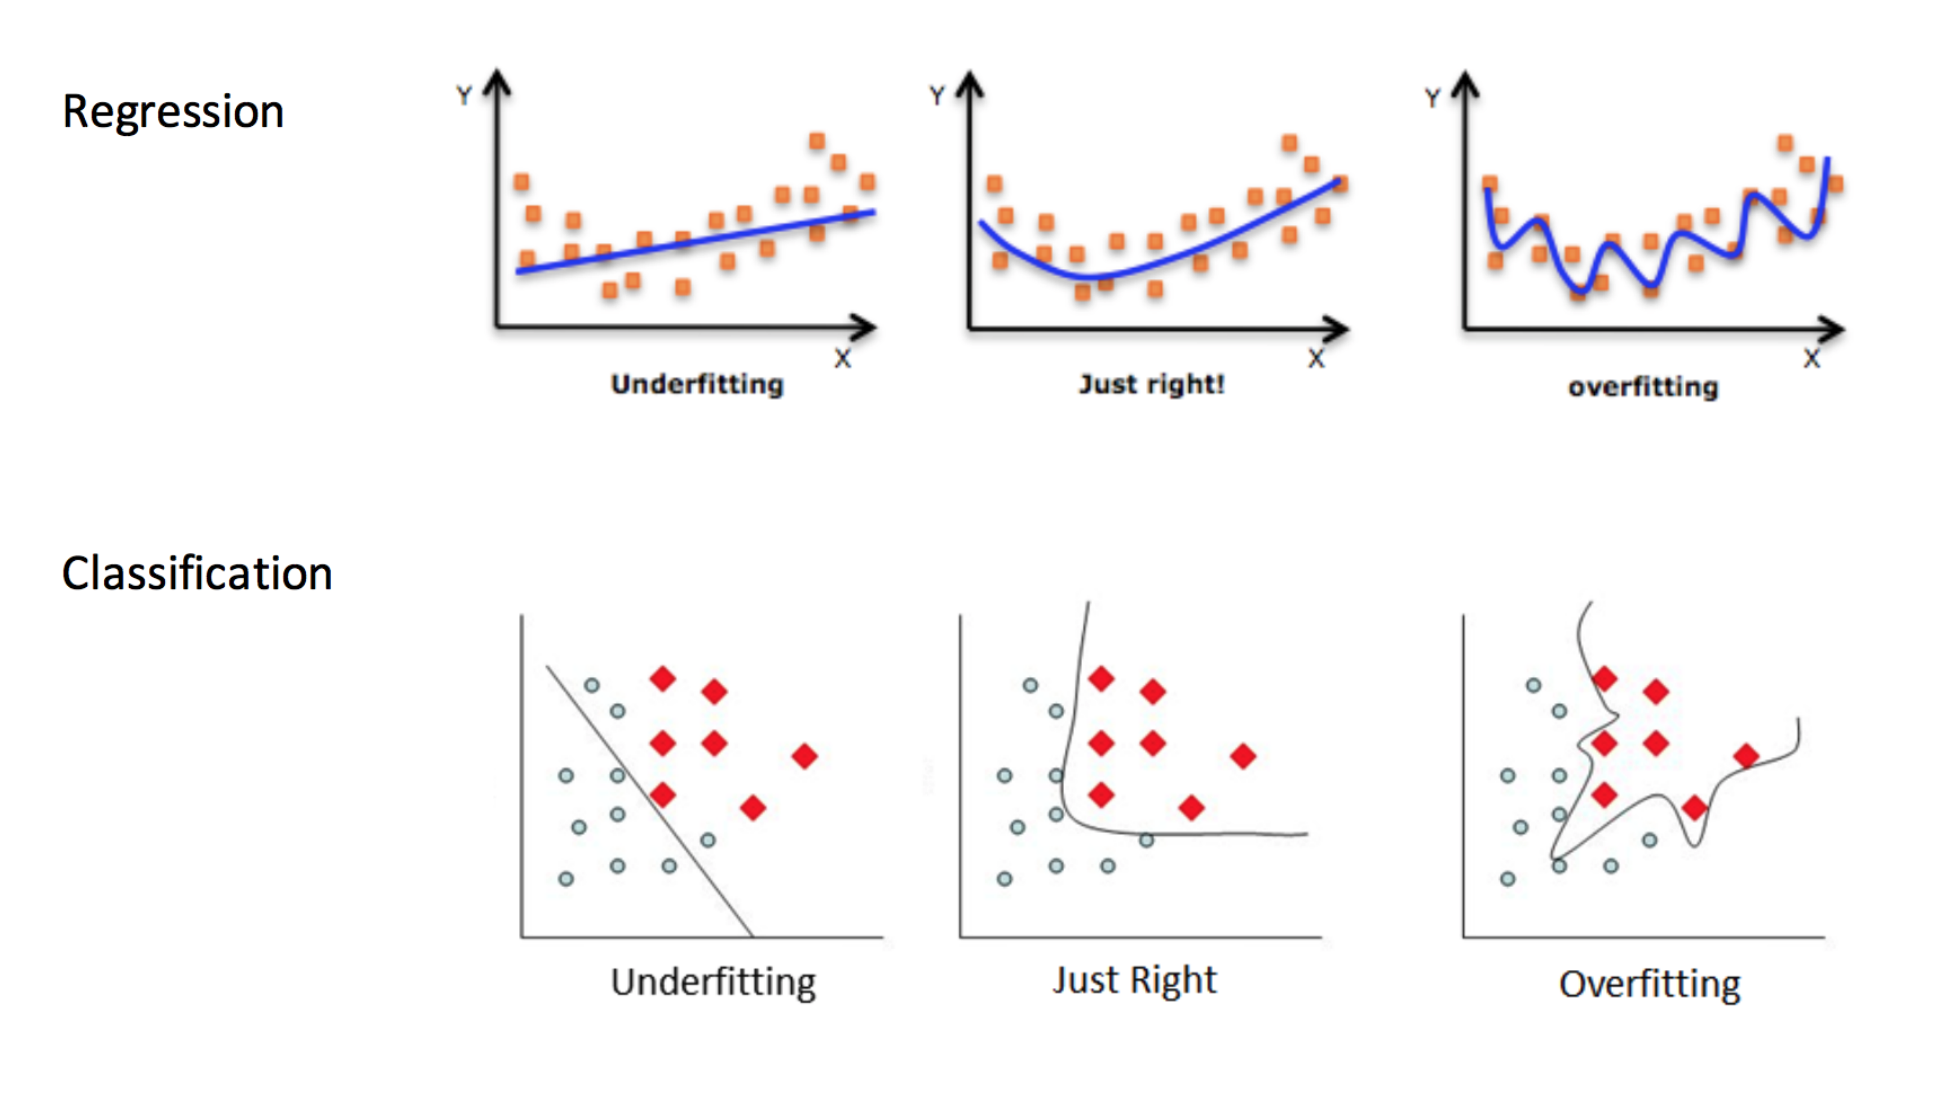
Underfitting & Overfitting
Which of these are under-, over-, and good fits?
![]()
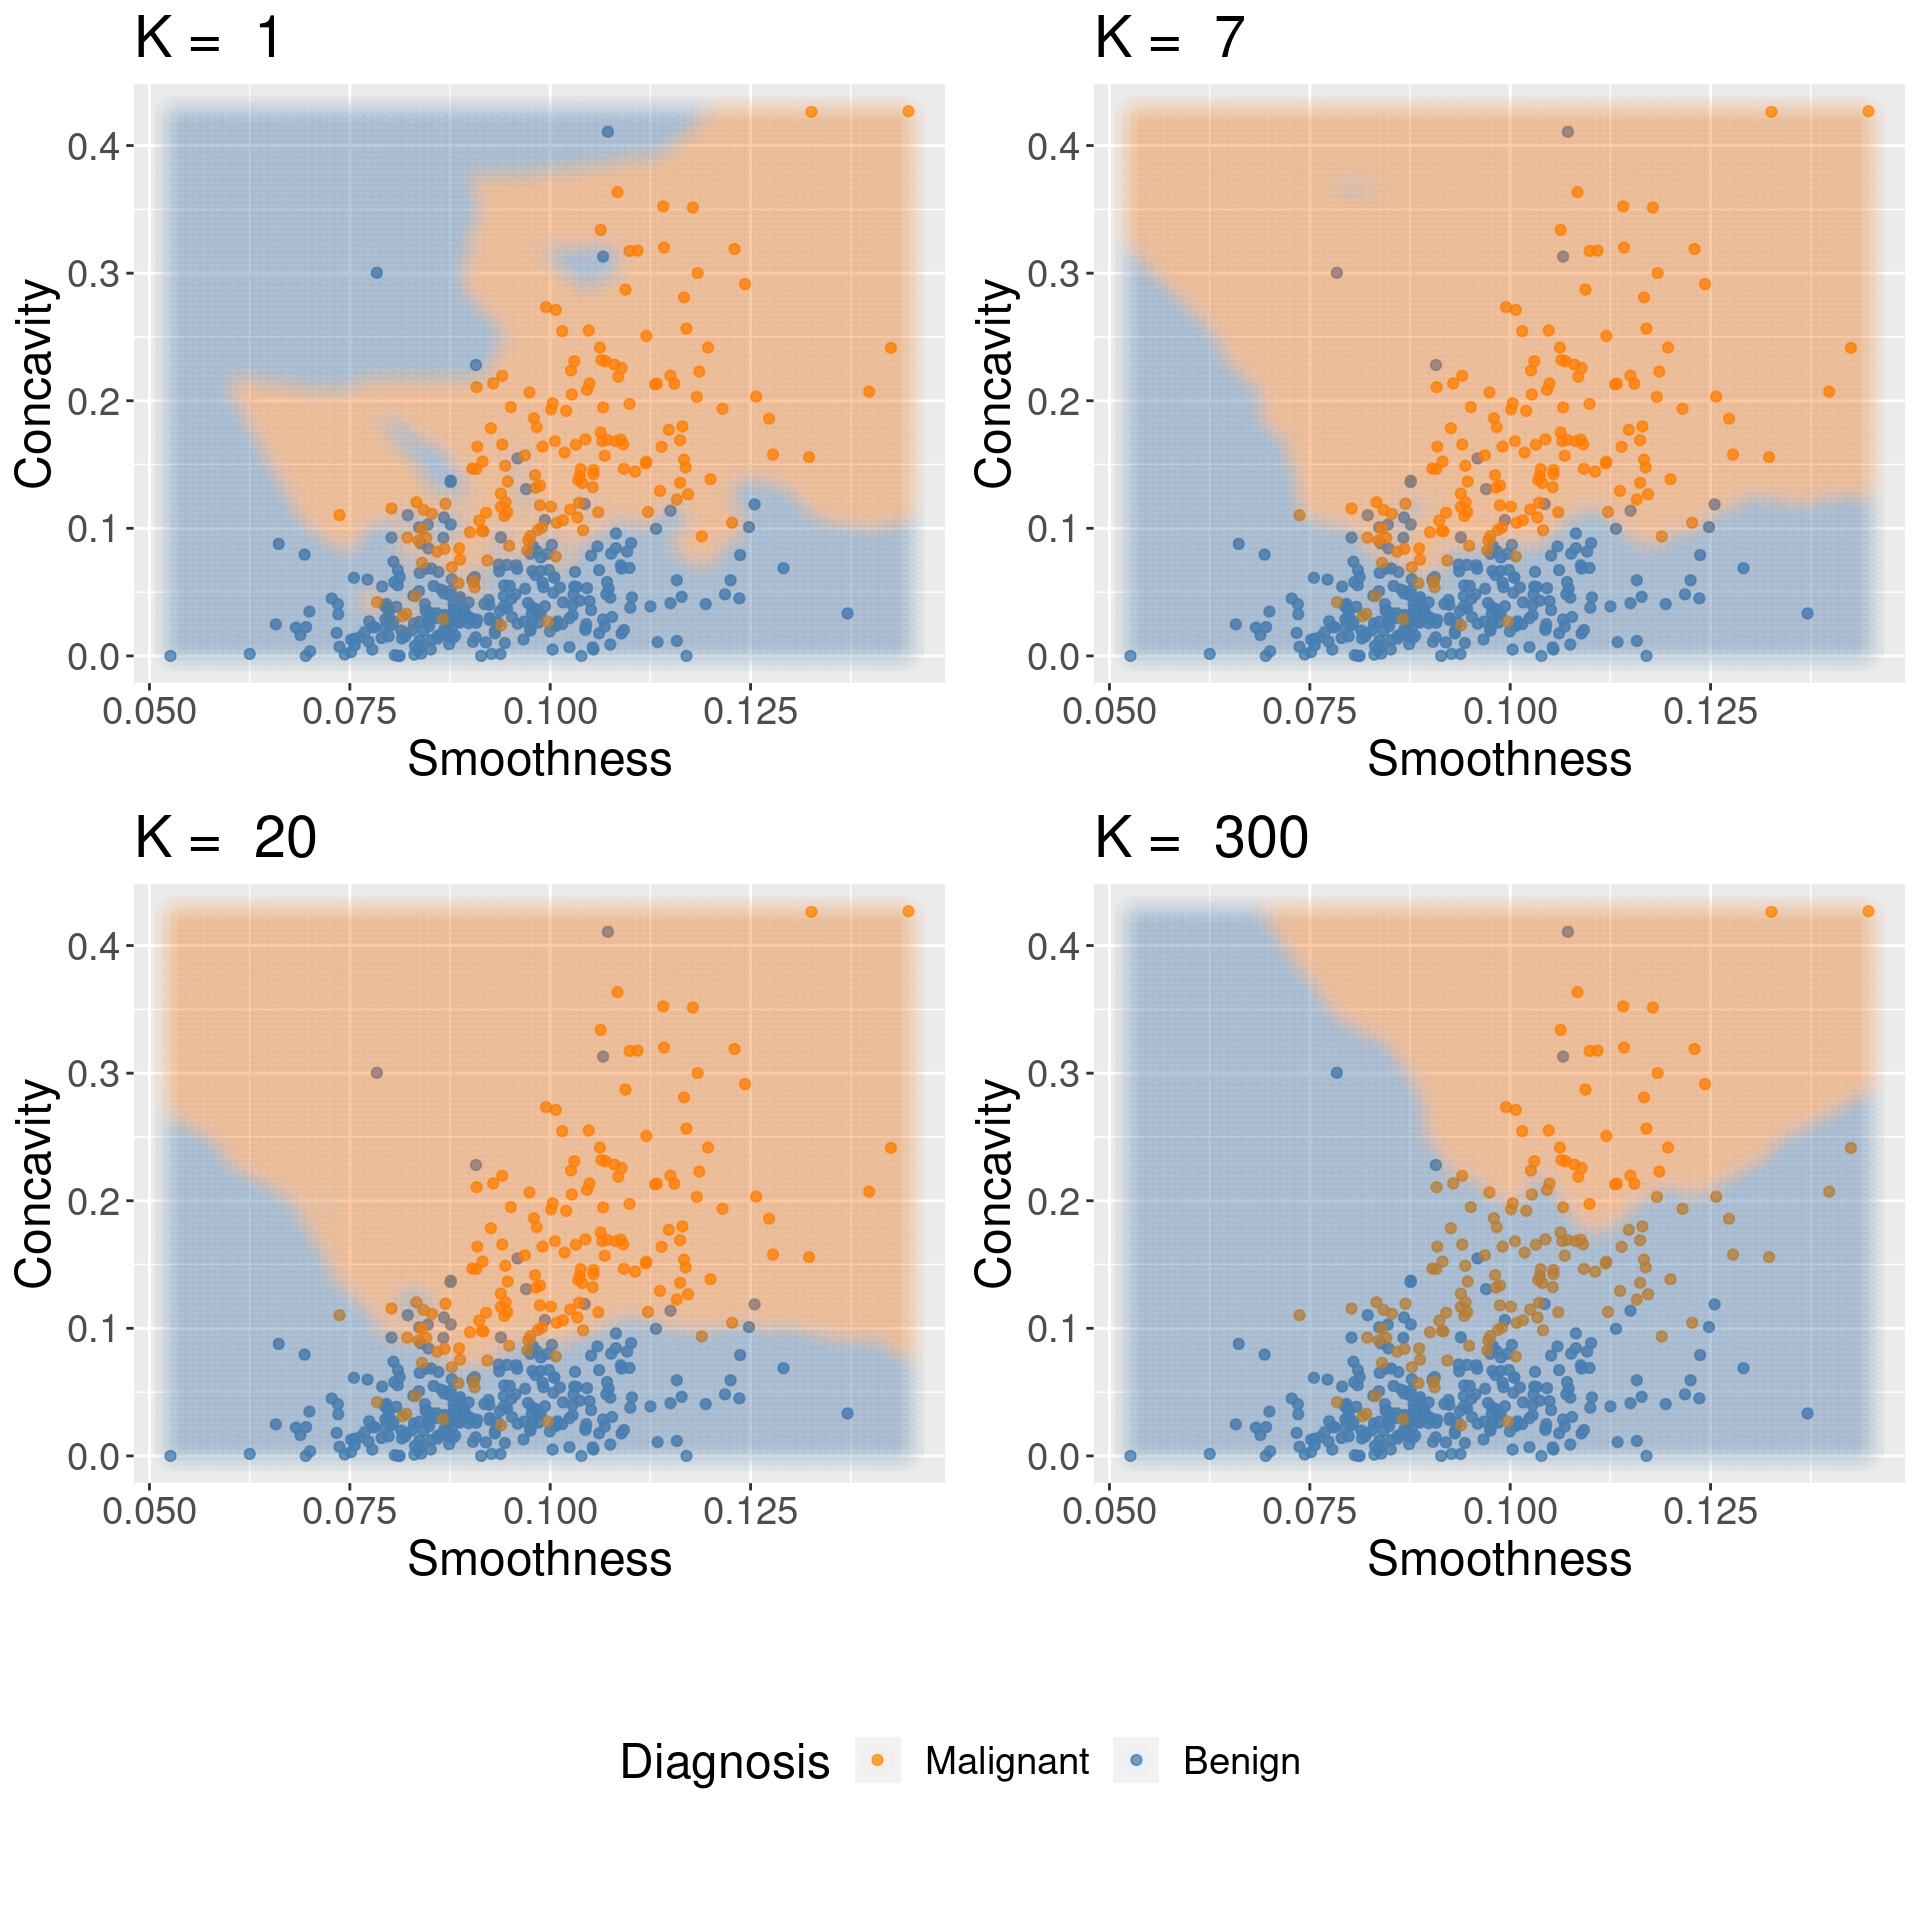
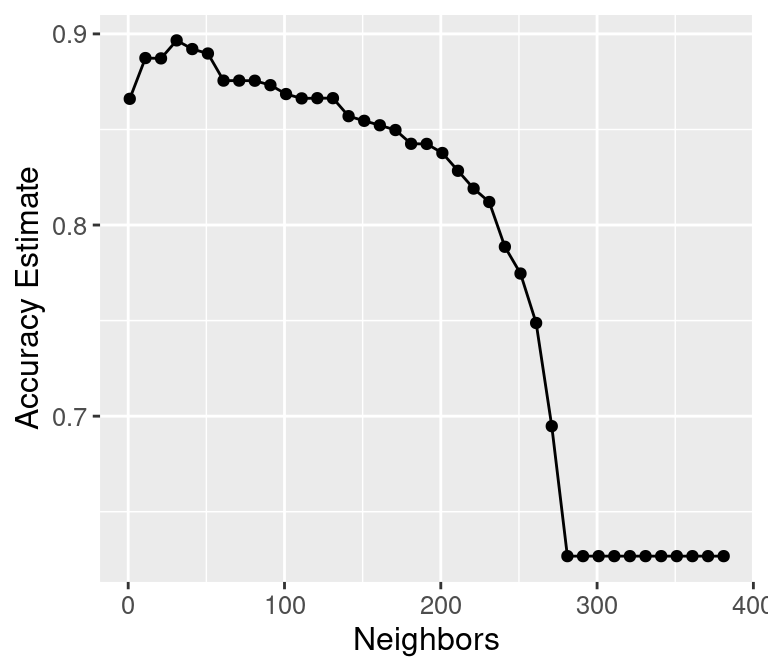
Underfitting & Overfitting
For KNN: small K overfits, large K underfits, and both cause lower accuracy
![]()
The Big Picture
![]()
Worksheet Time! Go for it!
Let’s finish our iClicker problems and start on this week’s worksheet.
There is no tutorial this week.