23 Data analysis pipelines with scripts
Learning Objectives
- Justify why analysis pipelines should be used over a single long script in data analysis projects, specifically in regards to how this affects reproducibility, maintainability and future derivatives of the work.
23.1 Data analysis pipelines
As analysis grows in length and complexity, one literate code document generally is not enough
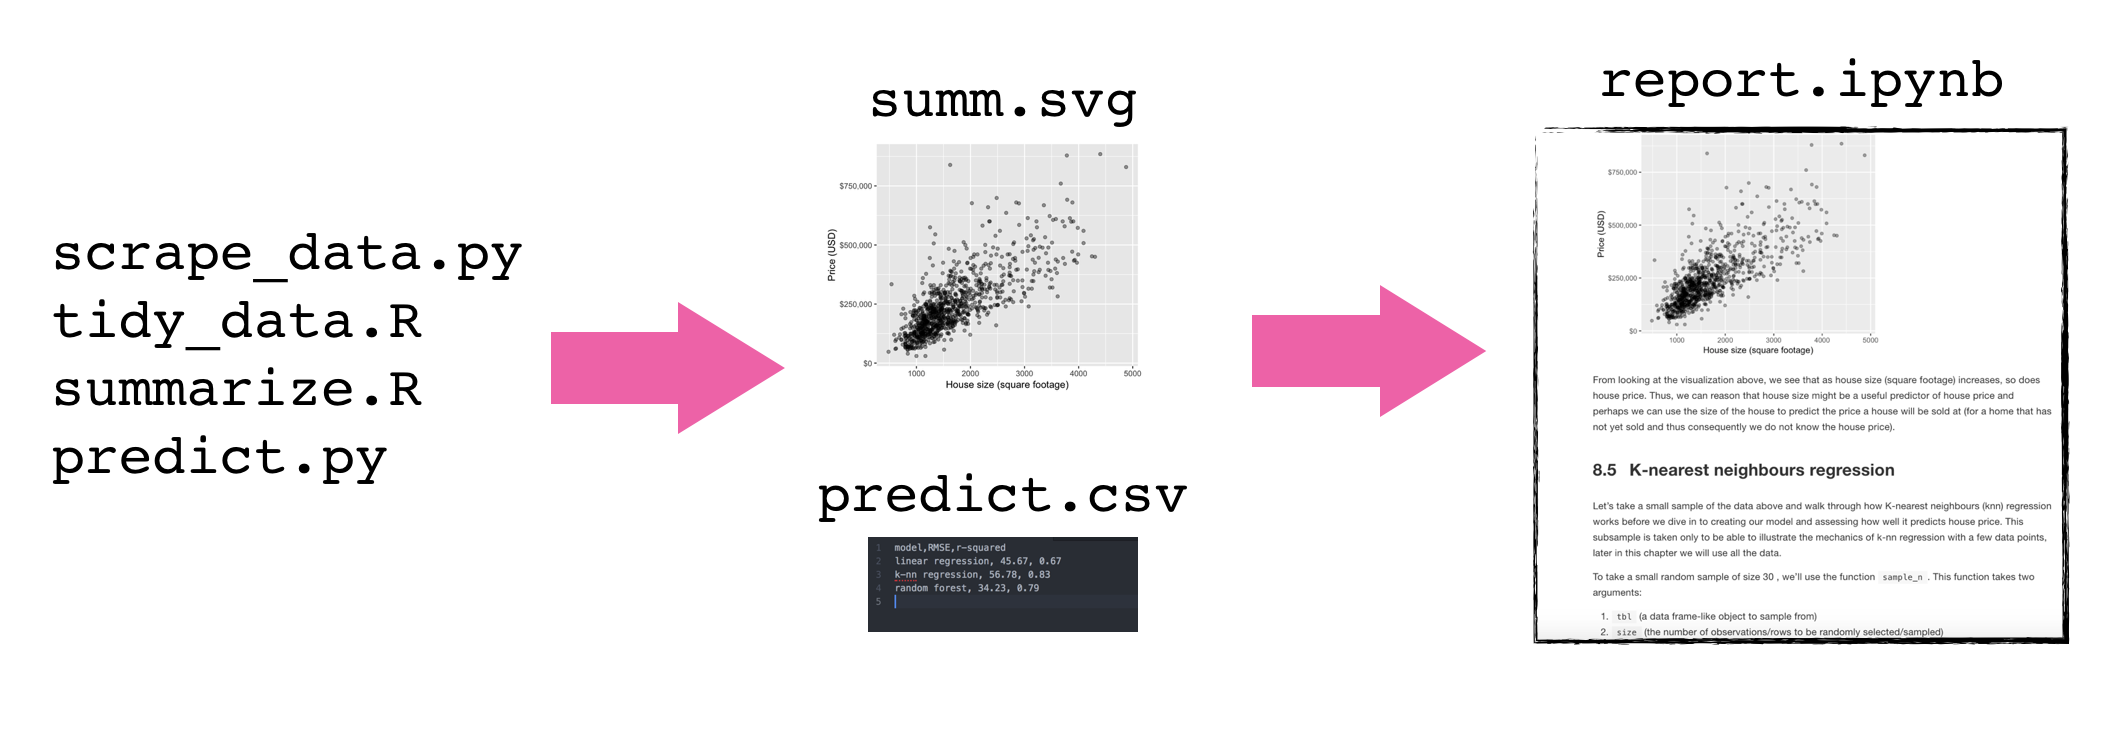
To improve code report readability (and code reproducibility and modularity) it is better to abstract at least parts of the code away (e.g, to scripts)
These scripts save figures and tables that will be imported into the final report

Adapted from Software Carpentry
To illustrate how to make a data analysis pipeline using a shell script to drive other scripts, we will work through an example together. Here are some set-up instructions so that we can do this together:
Set-up instructions
Click the green “Use this template” button from this GitHub repository to obtain a copy of it for yourself (do not fork it).
Clone this repository to your computer.
Let’s do some analysis!
Suppose we have a script, wordcount.py, that reads in a text file, counts the words in this text file, and outputs a data file:
python scripts/wordcount.py \
    --input_file=data/isles.txt \
    --output_file=results/isles.dat
If we view the first 5 rows of the data file using head,
head -5 results/isles.datwe can see that the file consists of one row per word. Each row shows the word itself, the number of occurrences of that word, and the number of occurrences as a percentage of the total number of words in the text file.
the 3822 6.7371760973
of 2460 4.33632998414
and 1723 3.03719372466
to 1479 2.60708619778
a 1308 2.30565838181
Suppose we also have a script, plotcount.py, that reads in a data file and save a plot of the 10 most frequently occurring words:
python scripts/plotcount.py \
    --input_file=results/isles.dat \
    --output_file=results/figure/isles.png
Together these scripts implement a data analysis pipeline:
- Read a data file.
- Perform an analysis on this data file.
- Write the analysis results to a new file.
- Plot a graph of the analysis results.
To document how we’d like the analysis to be run, so we (and others) have a record and can replicate it, we will build a shell script called run_all.sh. Let’s work to try to build this pipeline so it does all that!
# run_all.sh
# Tiffany Timbers, Nov 2017
#
# This driver script completes the textual analysis of
# 3 novels and creates figures on the 10 most frequently
# occuring words from each of the 3 novels. This script
# takes no arguments.
#
# Usage: bash run_all.sh

# perform wordcout on novels
python scripts/wordcount.py \
    --input_file=data/isles.txt \
    --output_file=results/isles.dat

# create plots
python scripts/plotcount.py \
    --input_file=results/isles.dat \
    --output_file=results/figure/isles.png
We actually have 4 books that we want to analyze, and then put the figures in a report.
- Read a data file.
- Perform an analysis on this data file.
- Write the analysis results to a new file.
- Plot a graph of the analysis results.
- Save the graph as an image, so we can put it in a paper.
Let’s extend our shell script to do that!
# run_all.sh
# Tiffany Timbers, Nov 2018

# This driver script completes the textual analysis of
# 3 novels and creates figures on the 10 most frequently
# occurring words from each of the 3 novels. This script
# takes no arguments.

# example usage:
# bash run_all.sh

# count the words
python scripts/wordcount.py \
    --input_file=data/isles.txt \
    --output_file=results/isles.dat
python scripts/wordcount.py \
    --input_file=data/abyss.txt \
    --output_file=results/abyss.dat
python scripts/wordcount.py \
    --input_file=data/last.txt \
    --output_file=results/last.dat
python scripts/wordcount.py \
    --input_file=data/sierra.txt \
    --output_file=results/sierra.dat

# create the plots
python scripts/plotcount.py \
    --input_file=results/isles.dat \
    --output_file=results/figure/isles.png
python scripts/plotcount.py \
    --input_file=results/abyss.dat \
    --output_file=results/figure/abyss.png
python scripts/plotcount.py \
    --input_file=results/last.dat \
    --output_file=results/figure/last.png
python scripts/plotcount.py \
    --input_file=results/sierra.dat \
    --output_file=results/figure/sierra.png

# write the report
quarto render report/count_report.qmdFrom the breast cancer prediction example analysis repo, here is a data analysis pipeline using a shell script:
# run_all.sh
# Tiffany Timbers, Jan 2020

# download data
python src/download_data.py --out_type=feather --url=https://archive.ics.uci.edu/ml/machine-learning-databases/breast-cancer-wisconsin/wpbc.data --out_file=data/raw/wdbc.feather

# run eda report
Rscript -e "rmarkdown::render('src/breast_cancer_eda.Rmd')"

# pre-process data
Rscript src/pre_process_wisc.r --input=data/raw/wdbc.feather --out_dir=data/processed

# create exploratory data analysis figure and write to file
Rscript src/eda_wisc.r --train=data/processed/training.feather --out_dir=results

# tune model
Rscript src/fit_breast_cancer_predict_model.r --train=data/processed/training.feather --out_dir=results

# test model
Rscript src/breast_cancer_test_results.r --test=data/processed/test.feather --out_dir=results

# render final report
Rscript -e "rmarkdown::render('doc/breast_cancer_predict_report.Rmd', output_format = 'github_document')"
23.2 Discussion
What are the advantages to using a data analysis pipeline?
How “good” is a shell script as a data analysis pipeline? What might not be ideal about this?