Data analysis pipelines#
Topic learning objectives#
By the end of this topic, students should be able to:
Justify why analysis pipelines should be used over a single long script in data analysis projects, specifically in regards to how this affects reproducibility, maintainability and future derivatives of the work.
Write a simple automated analysis pipeline using workflow tool (e.g., GNU Make)
Discuss the advantage of using software that has a dependency graph for analysis pipelines compared to software that does not.
Data analysis pipelines#
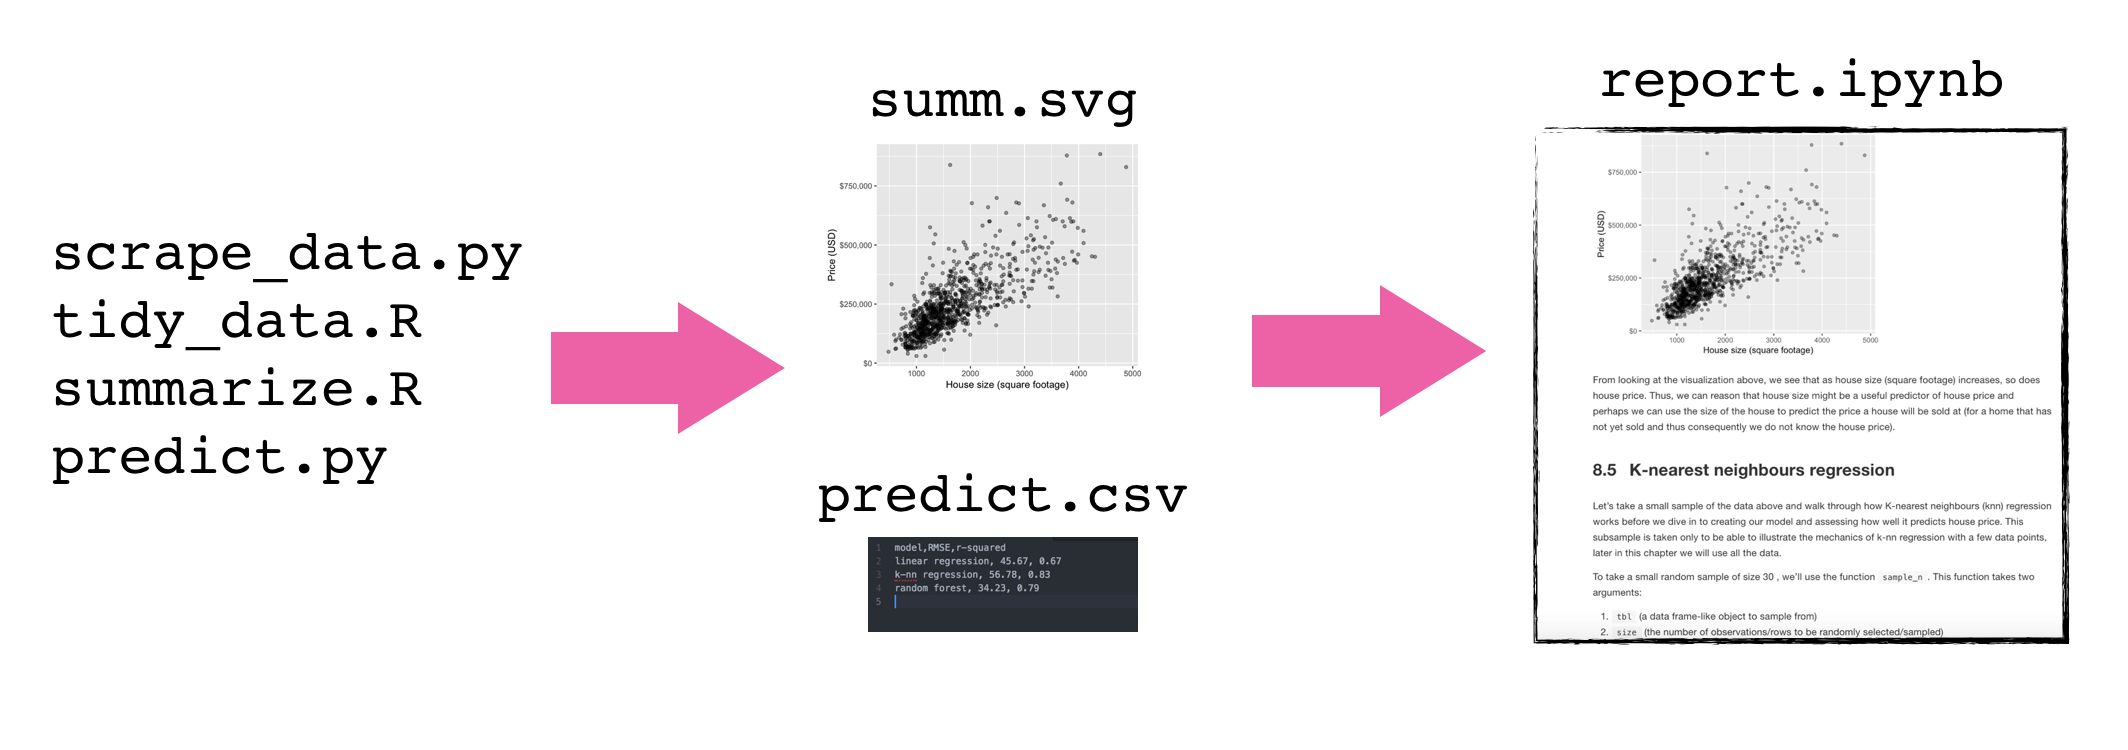
As analysis grows in length and complexity, one literate code document generally is not enough
To improve code report readability (and code reproducibility and modularity) it is better to abstract at least parts of the code away (e.g, to scripts)
These scripts save figures and tables that will be imported into the final report
Demo: building a Data Analysis pipeline using a Shell script tutorial#
adapted from Software Carpentry
To illustrate how to make a data analysis pipeline using a shell script to drive other scripts, we will work through an example together. Here are some set-up instructions so that we can do this together:
Set-up instructions#
Click the green “Use this template” button from this GitHub repository to obtain a copy of it for yourself (do not fork it).
Clone this repository to your computer.
Let’s do some analysis!#
Suppose we have a script, wordcount.py, that reads in a text file,
counts the words in this text file, and outputs a data file:
python scripts/wordcount.py \
    --input_file=data/isles.txt \
    --output_file=results/isles.dat
If we view the first 5 rows of the data file using head,
head -5 results/isles.dat
we can see that the file consists of one row per word. Each row shows the word itself, the number of occurrences of that word, and the number of occurrences as a percentage of the total number of words in the text file.
the 3822 6.7371760973
of 2460 4.33632998414
and 1723 3.03719372466
to 1479 2.60708619778
a 1308 2.30565838181
Suppose we also have a script, plotcount.py, that reads in a data
file and save a plot of the 10 most frequently occurring words:
python scripts/plotcount.py \
    --input_file=results/isles.dat \
    --output_file=results/figure/isles.png
Together these scripts implement a data analysis pipeline:
Read a data file.
Perform an analysis on this data file.
Write the analysis results to a new file.
Plot a graph of the analysis results.
To document how we’d like the analysis to be run, so we (and others) have a record and
can replicate it, we will build a shell script called run_all.sh. Let’s work to try
to build this pipeline so it does all that!
# run_all.sh
# Tiffany Timbers, Nov 2017
#
# This driver script completes the textual analysis of
# 3 novels and creates figures on the 10 most frequently
# occuring words from each of the 3 novels. This script
# takes no arguments.
#
# Usage: bash run_all.sh

# perform wordcout on novels
python scripts/wordcount.py \
    --input_file=data/isles.txt \
    --output_file=results/isles.dat

# create plots
python scripts/plotcount.py \
    --input_file=results/isles.dat \
    --output_file=results/figure/isles.png
We actually have 4 books that we want to analyze, and then put the figures in a report.
Read a data file.
Perform an analysis on this data file.
Write the analysis results to a new file.
Plot a graph of the analysis results.
Save the graph as an image, so we can put it in a paper.
Let’s extend our shell script to do that!
# run_all.sh
# Tiffany Timbers, Nov 2018

# This driver script completes the textual analysis of
# 3 novels and creates figures on the 10 most frequently
# occuring words from each of the 3 novels. This script
# takes no arguments.

# example usage:
# bash run_all.sh

# count the words
python scripts/wordcount.py \
    --input_file=data/isles.txt \
    --output_file=results/isles.dat
python scripts/wordcount.py \
    --input_file=data/abyss.txt \
    --output_file=results/abyss.dat
python scripts/wordcount.py \
    --input_file=data/last.txt \
    --output_file=results/last.dat
python scripts/wordcount.py \
    --input_file=data/sierra.txt \
    --output_file=results/sierra.dat

# create the plots
python scripts/plotcount.py \
    --input_file=results/isles.dat \
    --output_file=results/figure/isles.png
python scripts/plotcount.py \
    --input_file=results/abyss.dat \
    --output_file=results/figure/abyss.png
python scripts/plotcount.py \
    --input_file=results/last.dat \
    --output_file=results/figure/last.png
python scripts/plotcount.py \
    --input_file=results/sierra.dat \
    --output_file=results/figure/sierra.png

# write the report
quarto render report/count_report.qmd
Another example:#
From the breast cancer prediction example analysis repo, here is a data analysis pipeline using a shell script:
# run_all.sh
# Tiffany Timbers, Jan 2020

# download data
python src/download_data.py --out_type=feather --url=https://archive.ics.uci.edu/ml/machine-learning-databases/breast-cancer-wisconsin/wpbc.data --out_file=data/raw/wdbc.feather

# run eda report
Rscript -e "rmarkdown::render('src/breast_cancer_eda.Rmd')"

# pre-process data
Rscript src/pre_process_wisc.r --input=data/raw/wdbc.feather --out_dir=data/processed

# create exploratory data analysis figure and write to file
Rscript src/eda_wisc.r --train=data/processed/training.feather --out_dir=results

# tune model
Rscript src/fit_breast_cancer_predict_model.r --train=data/processed/training.feather --out_dir=results

# test model
Rscript src/breast_cancer_test_results.r --test=data/processed/test.feather --out_dir=results

# render final report
Rscript -e "rmarkdown::render('doc/breast_cancer_predict_report.Rmd', output_format = 'github_document')"
Discussion#
What are the advantages to using a data analysis pipeline?
How “good” is a shell script as a data analysis pipeline? What might not be ideal about this?
GNU Make as a data analysis pipeline tool#
We previously built a data analysis pipeline by using a shell script (we called it run_all.sh) to piece together and create a record of all the scripts and arguments we used in our analysis. That is a step in the right direction, but there were a few unsatisfactory things about this strategy:
It takes time to manually erase all intermediate and final files generated by analysis to do a complete test to see that everything is working from top to bottom
It runs every step every time. This can be problematic if some steps take a long time and you have only changed other, smaller parts of the analysis
Thus, to improve on this we are going to use the build and automation tool, Make, to make a smarter data analysis pipeline.
Makefile Structure#
Each block of code in a Makefile is called a rule, it looks something like this:
file_to_create.png : data_it_depends_on.dat script_it_depends_on.py
	python script_it_depends_on.py data_it_depends_on.dat file_to_create.png
file_to_create.pngis a target, a file to be created, or built.data_it_depends_on.datandscript_it_depends_on.pyare dependencies, files which are needed to build or update the target. Targets can have zero or more dependencies.:separates targets from dependencies.python script_it_depends_on.py data_it_depends_on.dat file_to_create.pngis an action, a command to run to build or update the target using the dependencies. Targets can have zero or more actions. Actions are indented using the TAB character, not 8 spaces.Together, the target, dependencies, and actions form a rule.
Structure if you have multiple targets from a scripts#
file_to_create_1.png file_to_create_2.png : data_it_depends_on.dat script_it_depends_on.py
	python script_it_depends_on.py data_it_depends_on.dat file_to_create
Demo: building a Data Analysis pipeline using Make, a tutorial#
adapted from Software Carpentry
Set-up instructions#
Click the green “Use this template” button from this GitHub repository to obtain a copy of it for yourself (do not fork it).
Clone this repository to your computer.
Good reference: http://swcarpentry.github.io/make-novice/reference
Create a file, called Makefile, with the following content:
# Count words.
results/isles.dat : data/isles.txt src/wordcount.py
	python scripts/wordcount.py \
        --input_file=data/isles.txt \
        --output_file=results/isles.dat
This is a simple build file, which for
GNU Make is called a Makefile - a file executed
by GNU Make. Let us go through each line in turn:
#denotes a comment. Any text from#to the end of the line is ignored by Make.results/isles.datis a target, a file to be created, or built.data/isles.txtandscripts/wordcount.pyare dependencies, a file that is needed to build or update the target. Targets can have zero or more dependencies.:separates targets from dependencies.python scripts/wordcount.py --input_file=data/isles.txt --output_file=results/isles.datis an action, a command to run to build or update the target using the dependencies. Targets can have zero or more actions.Actions are indented using the TAB character, not 8 spaces. This is a legacy of Make’s 1970’s origins.
Together, the target, dependencies, and actions form a rule.
Our rule above describes how to build the target results/isles.dat using the
action python scripts/wordcount.py and the dependency data/isles.txt.
By default, Make looks for a Makefile, called Makefile, and we can
run Make as follows:
$ make results/isles.dat
Make prints out the actions it executes:
python scripts/wordcount.py --input_file=data/isles.txt --output_file=results/isles.dat
If we see,
Makefile:3: *** missing separator. Stop.
then we have used a space instead of a TAB characters to indent one of our actions.
We don’t have to call our Makefile Makefile. However, if we call it
something else we need to tell Make where to find it. This we can do
using -f flag. For example:
$ make -f Makefile results/isles.dat
As we have re-run our Makefile, Make now informs us that:
make: `results/isles.dat' is up to date.
This is because our target, results/isles.dat, has now been created, and
Make will not create it again. To see how this works, let’s pretend to
update one of the text files. Rather than opening the file in an
editor, we can use the shell touch command to update its timestamp
(which would happen if we did edit the file):
$ touch data/isles.txt
If we compare the timestamps of data/isles.txt and results/isles.dat,
$ ls -l data/isles.txt results/isles.dat
then we see that results/isles.dat, the target, is now older
thandata/isles.txt, its dependency:
-rw-r--r--    1 mjj      Administ   323972 Jun 12 10:35 books/isles.txt
-rw-r--r--    1 mjj      Administ   182273 Jun 12 09:58 isles.dat
If we run Make again,
$ make results/isles.dat
then it recreates results/isles.dat:
python src/wordcount.py data/isles.txt results/isles.dat
When it is asked to build a target, Make checks the ‘last modification time’ of both the target and its dependencies. If any dependency has been updated since the target, then the actions are re-run to update the target.
We may want to remove all our data files so we can explicitly recreate
them all. We can introduce a new target, and associated rule, clean:
# Count words.
results/isles.dat : data/isles.txt src/wordcount.py
	python scripts/wordcount.py \
        --input_file=data/isles.txt \
        --output_file=results/isles.dat

clean :
	rm -f results/isles.dat
This is an example of a rule that has no dependencies. clean has no
dependencies on any .dat file as it makes no sense to create these
just to remove them. We just want to remove the data files whether or
not they exist. If we run Make and specify this target,
$ make clean
then we get:
rm -f *.dat
There is no actual thing built called clean. Rather, it is a
short-hand that we can use to execute a useful sequence of
actions.
Let’s add another rule to the end of Makefile:
results/isles.dat : data/isles.txt scripts/wordcount.py
	python scripts/wordcount.py \
        --input_file=data/isles.txt \
        --output_file=results/isles.dat

results/figure/isles.png : results/isles.dat scripts/plotcount.py
	python scripts/plotcount.py \
        --input_file=results/isles.dat \
        --output_file=results/figure/isles.png

clean :
	rm -f results/isles.dat
	rm -f results/figure/isles.png
the new target isles.png depends on the target isles.dat. So to make both, we can simply
type:
$ make results/figure/isles.png
$ ls
Let’s add another book:
results/isles.dat : data/isles.txt scripts/wordcount.py
	python scripts/wordcount.py \
        --input_file=data/isles.txt \
        --output_file=results/isles.dat

results/abyss.dat : data/abyss.txt scripts/wordcount.py
python scripts/wordcount.py \
    --input_file=data/abyss.txt \
    --output_file=results/abyss.dat

results/figure/isles.png : results/isles.dat scripts/plotcount.py
	python scripts/plotcount.py \
        --input_file=results/isles.dat \
        --output_file=results/figure/isles.png

results/figure/abyss.png : results/abyss.dat scripts/plotcount.py
    python scripts/plotcount.py \
        --input_file=results/abyss.dat \
        --output_file=results/figure/abyss.png

clean :
	rm -f results/isles.dat \
        results/abyss.dat
	rm -f results/figure/isles.png \
        results/figure/abyss.png
To run all of the commands, we need to type make
$ make results/figure/isles.png
$ make results/figure/abyss.png
OR we can add a target all to the very top of the Makefile
which will build the last of the dependencies.
all: results/figure/isles.png results/figure/abyss.png
Finish off the Makefile!#
Since we will also combine the figures into a report in the end, we will change our all target to being the rendered report file, and add a target for the rendered report file at the end:
# Makefile
# Tiffany Timbers, Nov 2018

# This driver script completes the textual analysis of
# 3 novels and creates figures on the 10 most frequently
# occuring words from each of the 3 novels. This script
# takes no arguments.

# example usage:
# make all

all : report/count_report.html

# count the words
results/isles.dat : data/isles.txt scripts/wordcount.py
	python scripts/wordcount.py \
        --input_file=data/isles.txt \
        --output_file=results/isles.dat

results/abyss.dat : data/abyss.txt scripts/wordcount.py
python scripts/wordcount.py \
    --input_file=data/abyss.txt \
    --output_file=results/abyss.dat

results/last.dat : data/last.txt scripts/wordcount.py
    python scripts/wordcount.py \
        --input_file=data/last.txt \
        --output_file=results/last.dat

results/sierra.dat : data/sierra.txt scripts/wordcount.py
    python scripts/wordcount.py \
        --input_file=data/sierra.txt \
        --output_file=results/sierra.dat

# create the plots
results/figure/isles.png : results/isles.dat scripts/plotcount.py
	python scripts/plotcount.py \
        --input_file=results/isles.dat \
        --output_file=results/figure/isles.png

results/figure/abyss.png : results/abyss.dat scripts/plotcount.py
    python scripts/plotcount.py \
        --input_file=results/abyss.dat \
        --output_file=results/figure/abyss.png

results/figure/last.png : results/last.dat scripts/plotcount.py
    python scripts/plotcount.py \
        --input_file=results/last.dat \
        --output_file=results/figure/last.png

results/figure/sierra.png : results/sierra.dat scripts/plotcount.py
    python scripts/plotcount.py \
        --input_file=results/sierra.dat \
        --output_file=results/figure/sierra.png

# write the report
report/count_report.html : report/count_report.qmd \
results/figure/isles.png \
results/figure/abyss.png \
results/figure/last.png \
results/figure/sierra.png
    quarto render report/count_report.qmd

clean :
	rm -f results/isles.dat \
        results/abyss.dat \
        results/last.dat \
        results/sierra.dat
	rm -f results/figure/isles.png \
        results/figure/abyss.png \
        results/figure/last.png \
        results/figure/sierra.png
	rm -rf report/count_report.html
Improving the Makefile#
Adding PHONY targets to run parts of the analysis (e.g., just counting the words, or just making the figures) can be very useful when iterating and refining a particular part of your analysis. Similarly, adding other PHONY targets to clean up parts of the analysis can help with this as well.
In the version of the Makefile below we do just that,
creating the following PHONY targets:
dats(counts words and saves to.datfiles)figs(creates figures)clean-dats(cleans up.datfiles)clean-figs(cleans up figure files)
# Makefile
# Tiffany Timbers, Nov 2018

# This driver script completes the textual analysis of
# 3 novels and creates figures on the 10 most frequently
# occuring words from each of the 3 novels. This script
# takes no arguments.

# example usage:
# make all

# run entire analysis
all: report/count_report.html

# count words
dats: results/isles.dat \
results/abyss.dat \
results/last.dat \
results/sierra.dat

results/isles.dat : scripts/wordcount.py data/isles.txt
	python scripts/wordcount.py \
		--input_file=data/isles.txt \
		--output_file=results/isles.dat
results/abyss.dat : scripts/wordcount.py data/abyss.txt
	python scripts/wordcount.py \
		--input_file=data/abyss.txt \
		--output_file=results/abyss.dat
results/last.dat : scripts/wordcount.py data/last.txt
	python scripts/wordcount.py \
		--input_file=data/last.txt \
		--output_file=results/last.dat
results/sierra.dat : scripts/wordcount.py data/sierra.txt
	python scripts/wordcount.py \
		--input_file=data/sierra.txt \
		--output_file=results/sierra.dat

# plot
figs : results/figure/isles.png \
	results/figure/abyss.png \
	results/figure/last.png \
	results/figure/sierra.png

results/figure/isles.png : scripts/plotcount.py results/isles.dat
	python scripts/plotcount.py \
		--input_file=results/isles.dat \
		--output_file=results/figure/isles.png
results/figure/abyss.png : scripts/plotcount.py results/abyss.dat
	python scripts/plotcount.py \
		--input_file=results/abyss.dat \
		--output_file=results/figure/abyss.png
results/figure/last.png : scripts/plotcount.py results/last.dat
	python scripts/plotcount.py \
		--input_file=results/last.dat \
		--output_file=results/figure/last.png
results/figure/sierra.png : scripts/plotcount.py results/sierra.dat
	python scripts/plotcount.py \
		--input_file=results/sierra.dat \
		--output_file=results/figure/sierra.png

# write the report
report/count_report.html : report/count_report.qmd figs
	quarto render report/count_report.qmd

clean-dats :
	rm -f results/isles.dat \
		results/abyss.dat \
		results/last.dat \
		results/sierra.dat

clean-figs :
	rm -f results/figure/isles.png \
	results/figure/abyss.png \
	results/figure/last.png \
	results/figure/sierra.png

clean-all : clean-dats \
	clean-figs
	rm -f report/count_report.html
	rm -rf report/count_report_files
Pattern matching and variables in a Makefile#
It is possible to DRY out a Makefile and use variables.
Using wild cards and pattern matching in a makefile is possible, but the syntax is not very readable. So if you choose to do this proceed with caution. Example of how to do this are here: http://swcarpentry.github.io/make-novice/05-patterns/index.html
As for variables in a Makefile, in most cases we actually do not want to do this. The reason is that we want this file to be a record of what we did to run our analysis (e.g., what files were used, what settings were used, etc). If you start using variables with your Makefile, then you are shifting the problem of recording how your analysis was done to another file. There needs to be some file in your repo that captures what variables were called so that you can replicate your analysis. Examples of using variables in a Makefile are here: http://swcarpentry.github.io/make-novice/06-variables/index.html